Assignment 5. ( commands for octave 3.0.1)
Question 1. Octave commands for constructing a 256 by 256 matrix with entries of 0 everywhere except inside a circle with a radius of 50 where the values are 1.
function val = circle(x,y)
> val=zeros(256);
> for i=1:256; for j=1:256;
> if (i-x)^2+(j-y)^2 <=2500; > val(i,j)=1;
> end
> end
> end
> end
> imshow(circle(128,128))
Question 2. Give octave commands to draw the top part of figure 6.4
> P(:,:,1)=circle(156,103);
> P(:,:,2)=circle(113,128);
> P(:,:,3)=circle(156,153);
>imshow(255*P)
Question 3.
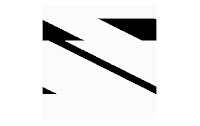
Skewing bigT with s=2.
> bigT = 255*ones(256);
octave-3.0.1.exe:68> bigT(30:79,64:191)=zeros(50,128);
octave-3.0.1.exe:69> bigT(50:199,111:146)= zeros(150,36);
octave-3.0.1.exe:70> Ts = zeros(256);
octave-3.0.1.exe:71> for i=1:256; for j=1:256;
> Ts(i,round(mod(j+2*i,256)+1))=bigT(i,j); end; end;
octave-3.0.1.exe:72> imshow(Ts)
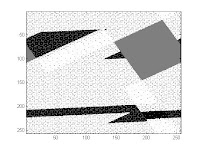
rotating the skewed Ts by 7pi/6
Trot=128*ones(256);
c=cos(7*pi/6)
s=sin(7*pi/6)
for i=1:256; for j=1:256;
Trot(round(mod(i*c-j*s,256)+1),round(mod(i*s+j*c,256)+1))=Ts(i,j);
end
end
imshow(Trot)
Question 1. Octave commands for constructing a 256 by 256 matrix with entries of 0 everywhere except inside a circle with a radius of 50 where the values are 1.
function val = circle(x,y)
> val=zeros(256);
> for i=1:256; for j=1:256;
> if (i-x)^2+(j-y)^2 <=2500; > val(i,j)=1;
> end
> end
> end
> end
> imshow(circle(128,128))
Question 2. Give octave commands to draw the top part of figure 6.4
> P(:,:,1)=circle(156,103);
> P(:,:,2)=circle(113,128);
> P(:,:,3)=circle(156,153);
>imshow(255*P)
Question 3.
Skewing bigT with s=2.
> bigT = 255*ones(256);
octave-3.0.1.exe:68> bigT(30:79,64:191)=zeros(50,128);
octave-3.0.1.exe:69> bigT(50:199,111:146)= zeros(150,36);
octave-3.0.1.exe:70> Ts = zeros(256);
octave-3.0.1.exe:71> for i=1:256; for j=1:256;
> Ts(i,round(mod(j+2*i,256)+1))=bigT(i,j); end; end;
octave-3.0.1.exe:72> imshow(Ts)
rotating the skewed Ts by 7pi/6
Trot=128*ones(256);
c=cos(7*pi/6)
s=sin(7*pi/6)
for i=1:256; for j=1:256;
Trot(round(mod(i*c-j*s,256)+1),round(mod(i*s+j*c,256)+1))=Ts(i,j);
end
end
imshow(Trot)

 Above is the graph for wavelength versus y. It represents the wavelengths for different saturations of green.
-yellow.jpg) Yellow component of the image in problem 6.6 as it would appear on monochrome monitor.
Yellow component of the image in problem 6.6 as it would appear on monochrome monitor.-magenta.jpg) Magenta component of the image in problem 6.6 as it would appear on monochrome monitor.
Magenta component of the image in problem 6.6 as it would appear on monochrome monitor.-cyan.jpg)
CMYfedintoRGB.jpg)

